
Investigation into the Inefficiencies of Node.js Http Streams
Published on:Update: 2017-08-01: I posted this question on Stackoverflow, which was subsequently answered. Check it out!
Previously, I wrote a Rust TLS termination proxy where I tested it with a Node.js echo server and noted the terrible performance. This post will be a deeper dive into this problem. See this post on stackoverflow.
The weird thing is I don’t know what the problem is, but I know the solution. Let me explain.
Echo Server Implementations
On node v8.1.4 or v6.11.1:
I started out with the following echo server implementation, which I will refer to as pipe.js or pipe.
const http = require('http');

const handler = (req, res) => req.pipe(res);
http.createServer(handler).listen(3001);
And I benchmarked it with wrk and the following lua script (shortened for brevity) that will send a small body as a payload.
wrk.method = "POST"
wrk.body   = string.rep("a", 10)
At 2k requests per second and 44ms of average latency, performance is not great.
So I wrote another implementation that uses intermediate buffers until the request is finished and then writes those buffers out. I will refer to this as buffer.js or buffer.
const http = require('http');

const handler = (req, res) => {
  let buffs = [];
  req.on('data', (chunk) => {
    buffs.push(chunk);
  });
  req.on('end', () => {
    res.write(Buffer.concat(buffs));
    res.end();
  });
};
http.createServer(handler).listen(3001);
Performance drastically changed with buffer.js servicing 20k requests per second at 4ms of average latency.
For those that are visual learners, the graph below depicts the average number of requests serviced over 5 runs and various latency percentiles (p50 is median).
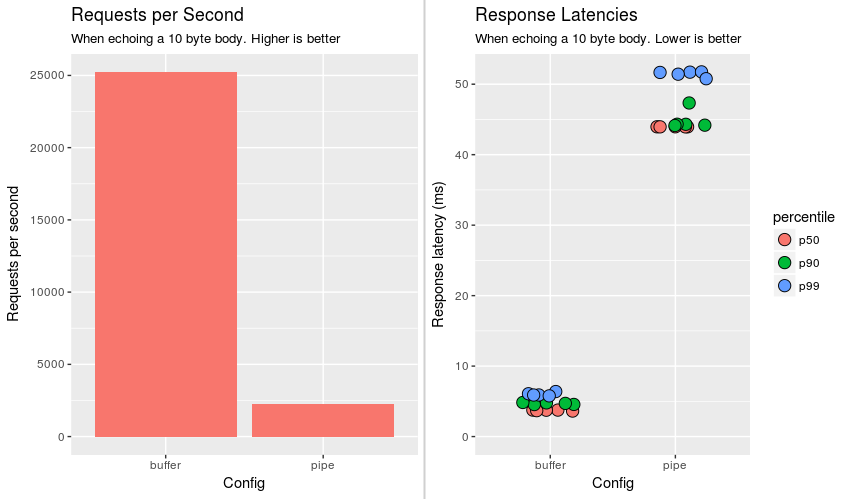
Performance of buffer vs pipe
So, buffer is an order of magnitude better in all categories. My question is why?
What follows next are my investigation notes, hopefully they are at least educational.
Response Behavior
Both implementations have been crafted so that they will give the same exact
response as returned by curl -D - --raw. If given a body of 10 d’s, both will
return the exact same response (with modified time, of course):
HTTP/1.1 200 OK
Date: Thu, 20 Jul 2017 18:33:47 GMT
Connection: keep-alive
Transfer-Encoding: chunked

a
dddddddddd
0
Both output 128 bytes (remember this).
Interesting tidbit, we can modify buffer.js to remove the res.write and
write the buffer in res.end(). The response will now not be chunked encoded.
The Mere Fact of Buffering
Semantically, the only difference between the two implementations is that
pipe.js writes data while the request hasn’t ended. This might make one
suspect that there could be multiple data events in buffer.js. This is not
true.
req.on('data', (chunk) => {
  console.log(`chunk length: ${chunk.length}`);
  buffs.push(chunk);
});
req.on('end', () => {
  console.log(`buffs length: ${buffs.length}`);
  res.write(Buffer.concat(buffs));
  res.end();
});
Empirically:
- Chunk length will always be 10
- Buffers length will always be 1
Since there will only ever be one chunk, what happens if we remove buffering and implement a poor man’s pipe:
const http = require('http');

const handler = (req, res) => {
  req.on('data', (chunk) => res.write(chunk));
  req.on('end', () => res.end());
};
http.createServer(handler).listen(3001);
Turns out, this has as abysmal performance as pipe.js. I find this
interesting because the same number of res.write and res.end calls are made
with the same parameters. My best guess so far is that the performance
differences are due to sending response data after the request data has ended.
Profiling
I profiled both application using the simple profiling guide (–prof).
I’ve included only the relevant lines:
pipe.js
 [Summary]:
   ticks  total  nonlib   name
   2043   11.3%   14.1%  JavaScript
  11656   64.7%   80.7%  C++
     77    0.4%    0.5%  GC
   3568   19.8%          Shared libraries
    740    4.1%          Unaccounted

 [C++]:
   ticks  total  nonlib   name
   6374   35.4%   44.1%  syscall
   2589   14.4%   17.9%  writev
buffer.js
 [Summary]:
   ticks  total  nonlib   name
   2512    9.0%   16.0%  JavaScript
  11989   42.7%   76.2%  C++
    419    1.5%    2.7%  GC
  12319   43.9%          Shared libraries
   1228    4.4%          Unaccounted

 [C++]:
   ticks  total  nonlib   name
   8293   29.6%   52.7%  writev
    253    0.9%    1.6%  syscall
We see that in both implementations, C++ dominates time; however, the functions that dominate are swapped. Syscalls account for nearly half the time for pipe, yet only 1% for buffer (forgive my rounding). Next step, which syscalls are the culprit?
Strace Here We Come
Invoking strace like strace -c node pipe.js will give us a summary of the syscalls. Here are the top syscalls:
pipe.js
% time     seconds  usecs/call     calls    errors syscall
------ ----------- ----------- --------- --------- ----------------
 43.91    0.014974           2      9492           epoll_wait
 25.57    0.008720           0    405693           clock_gettime
 20.09    0.006851           0     61748           writev
  6.11    0.002082           0     61803       106 write
buffer.js
% time     seconds  usecs/call     calls    errors syscall
------ ----------- ----------- --------- --------- ----------------
 42.56    0.007379           0    121374           writev
 32.73    0.005674           0    617056           clock_gettime
 12.26    0.002125           0    121579           epoll_ctl
 11.72    0.002032           0    121492           read
  0.62    0.000108           0      1217           epoll_wait
The top syscall for pipe (epoll_wait) with 44% of the time is only 0.6% of
the time for buffer (a 140x increase). While there is a large time
discrepancy, the number of times epoll_wait is invoked is less lopsided with
pipe calling epoll_wait ~8x more often. We can derive a couple bits of
useful information from that statement, such that pipe calls epoll_wait
constantly and an average, these calls are heavier than the epoll_wait for
buffer.
For buffer, the top syscall is writev, which is expected considering most
of the time should be spent writing data to a socket.
Logically the next step is to take a look at these epoll_wait statements with
regular strace, which showed buffer always contained epoll_wait with 100
events (representing the hundred connections used with wrk) and pipe had
less than 100 most of the time. Like so:
pipe.js
epoll_wait(5, [.16 snip.], 1024, 0) = 16
buffer.js
epoll_wait(5, [.100 snip.], 1024, 0) = 100
Graphically:
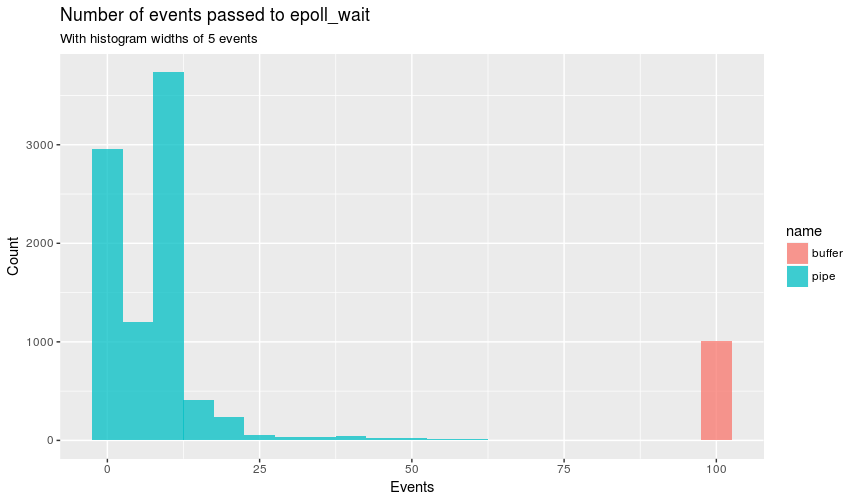
Comparison of the number of events passed to epoll_wait
This explains why there are more epoll_wait in pipe, as epoll_wait
doesn’t service all the connections in one event loop. The epoll_wait for
zero events makes it look like the event loop is idle! All this doesn’t explain
why epoll_wait takes up more time for pipe, as from the man page it states
that epoll_wait should return immediately:
specifying a timeout equal to zero cause epoll_wait() to return immediately, even if no events are available.
While the man page says the function returns immediately, can we confirm this? strace -T to the rescue:
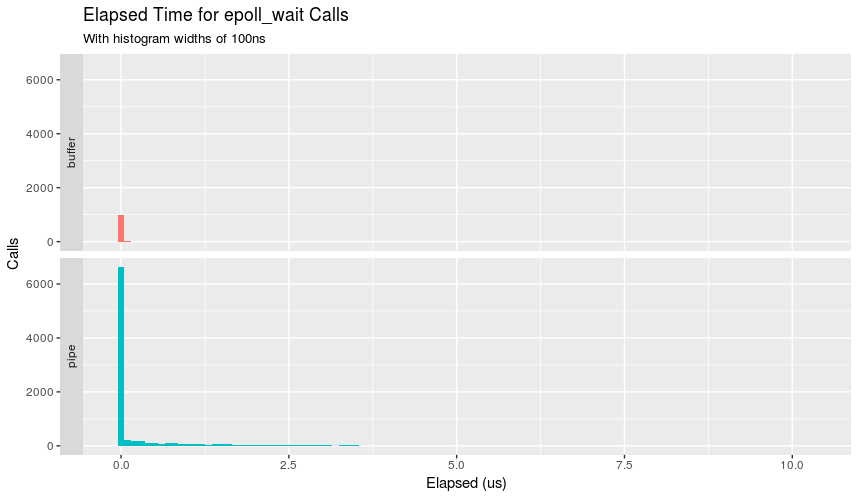
Comparison in latency for epoll_wait to return
Besides supporting that buffer has fewer calls, we can also see that nearly all calls took less than 100ns. Pipe has a much more interesting distribution showing that while most calls take under 100ns, a non-negligible amount take longer and land into the microsecond land.
Strace did find another oddity, and that’s with writev. The return value is
the number of bytes written.
pipe.js
writev(11, [{"HTTP/1.1 200 OK\r\nDate: Thu, 20 J"..., 109},
	{"\r\n", 2}, {"dddddddddd", 10}, {"\r\n", 2}], 4) = 123
buffer.js
writev(11, [{"HTTP/1.1 200 OK\r\nDate: Thu, 20 J"..., 109},
  {"\r\n", 2}, {"dddddddddd", 10}, {"\r\n", 2}, {"0\r\n\r\n", 5}], 5) = 128
Remember when I said that both output 128 bytes? Well, writev returned 123
bytes for pipe and 128 for buffer. The five bytes difference for pipe is
reconciled in a subsequent write call for each writev.
write(44, "0\r\n\r\n", 5)
And if I’m not mistaken, write syscalls are blocking.
Conclusion
If I have to make an educated guess, I would say that piping when the request
is not finished causes write calls. These blocking calls significantly reduce
the throughput partially through more frequent epoll_wait statements. Why
write is called instead of a single writev that is seen in buffer is
beyond me.
The kicker? In the official Node.js guide you can see how the guide starts with the buffer implementation and then moves to pipe! If the pipe implementation is in the official guide there shouldn’t be such a performance hit, right?
July 31st 2017 EDIT
My initial hypothesis that writing the echoed body after the request stream has finished increases performance has been disproved by @robertklep with his readable.js (or readable) implementation:
const http   = require('http');
const BUFSIZ = 2048;

const handler = (req, res) => {
	req.on('readable', _ => {
		let chunk;
		while (null !== (chunk = req.read(BUFSIZ))) {
			res.write(chunk);
		}
	});
	req.on('end', () => {
		res.end();
	});
};
http.createServer(handler).listen(3001);
Readable performed at the same level as buffer while writing data before the end event. If anything this makes me more confused because the only difference between readable and my initial poor man’s pipe implementation is the difference between the data and readable event and yet that caused a 10x performance increase. But we know that the data event isn’t inherently slow because we used it in our buffer code.
For the curious, strace on readable reported writev outputs all 128 bytes output like buffer
This is perplexing!
Comments
If you'd like to leave a comment, please email [email protected]
This is awesome.
So, if you initialise the requests by disabling the chunked mode, maybe it will be better?