
The Difficulty of Performance Evaluation of HikariCP in Dropwizard
Published on:May 2nd 2017 Update
The author of HikariCP posted a really informative comment here on several shortfalls and that the test wasn’t really a fair comparison between HikariCP and Tomcat. This article is provides context for the comment. Once read I also urge readers to follow the conversation between Brett and I over on the HikariCP mailing list. I created a benchmark repo so that others may reproduce results.
Introduction
By default, Dropwizard bundles Tomcat JDBC for database connection pooling. Tomcat JDBC boasts safety and performance. However, Tomcat JDBC isn’t the only competition, HikariCP exists (among others), and claims to significantly beat other connection pools (including Tomcat) in terms of safety and performance. Just look at the advertised JMH Benchmarks to see Hikari at 10x connection cycles than the closest competitor and 2x the number of statements cycles.
What happens when we replace Tomcat JDBC with Hikari? Well, I’m not the first, second, or third to have this thought. The only performance metrics offered is from the first project, and they paint a very different story with HikariCP up to ten times slower! I set out to verify these numbers.
As an aside, this article is titled “The Difficulty of” because there is not a clear conclusion to this article. Emebedding database connection pools inside of a web connection pools that sits on the same box as the configured database on a configured virtual machine benchmarked from another virtual machine introduces nearly an uncountable number of options and knobs. But I believe in reproducibility and have included my setup and findings so that others may have a better inkling for performance.
Our experiment will be to create an endpoint as a frontend to querying Stackoverflow questions by user id.
Data
The data used in this experiment is the dataset (200MB gzip link) from a “A simple dataset of Stack Overflow questions and tags”.
Below is a snippet of the data using the excellent xsv tool:
$ gzip -d -c questions.csv.gz | xsv slice --end 10 | xsv table

Id  CreationDate          ClosedDate            DeletionDate          Score  OwnerUserId  AnswerCount
1   2008-07-31T21:26:37Z  NA                    2011-03-28T00:53:47Z  1      NA           0
4   2008-07-31T21:42:52Z  NA                    NA                    458    8            13
6   2008-07-31T22:08:08Z  NA                    NA                    207    9            5
8   2008-07-31T23:33:19Z  2013-06-03T04:00:25Z  2015-02-11T08:26:40Z  42     NA           8
9   2008-07-31T23:40:59Z  NA                    NA                    1410   1            58
11  2008-07-31T23:55:37Z  NA                    NA                    1129   1            33
13  2008-08-01T00:42:38Z  NA                    NA                    451    9            25
14  2008-08-01T00:59:11Z  NA                    NA                    290    11           8
16  2008-08-01T04:59:33Z  NA                    NA                    78     2            5
17  2008-08-01T05:09:55Z  NA                    NA                    114    2            11
The command finishes instantly as xsv asks gzip to stop decompressing after the first ten rows. The efficiency of that statement makes me giddy; like I’m clever.
PostgreSQL
Our database of choice will be Postgres, but we’ll need to configure the box to aid performance. PostgreSQL 9.0 High Performance comes chock-full of performance tips. The following tips were applied from the book:
- Set the disk read ahead to 4096: blockdev –setra 4096 /dev/sda
- Prevent the OS from updating file times by mounting the filesystem with
noatime - vm.swappiness=0
- vm.overcommit_memory=2
Caveat, it is most likely that none of these tweaks will have a significant impact because query will be against a single user (so Postgres won’t have to go far to fetch the data from its cache).
The following Postgres configurations were taken from PGTune for a 4GB web application.
max_connections = 200
shared_buffers = 1GB
effective_cache_size = 3GB
work_mem = 5242kB
maintenance_work_mem = 256MB
min_wal_size = 1GB
max_wal_size = 2GB
checkpoint_completion_target = 0.7
wal_buffers = 16MB
default_statistics_target = 10
The SQL
There’ll only be one table for all the data. We’ll first load the data using
Postgres’s awesome
COPY command (the
data should be uncompressed first unless using the PROGRAM directive)
CREATE TABLE questions (
    id serial PRIMARY KEY,
    creationDate TIMESTAMPTZ,
    closedDate TIMESTAMPTZ,
    deletionDate TIMESTAMPTZ,
    score int,
    ownerUserId int,
    answerCount int
);

COPY questions FROM '/home/nick/questions.csv'
WITH (HEADER, FORMAT CSV, NULL 'NA');

CREATE INDEX user_idx ON questions(ownerUserId);
Notice the index on the user id was created at the end – for performance reasons.
The Java
For the application code, the database interactions are through JDBI, which allows you to write the SQL statements, in an elegant manner. I realize ORMs exist, but I’m much more comfortable writing the SQL statements myself.
Below we have our query by user id to retrieve their questions asked.
public interface QuestionQuery {
    @SqlQuery("SELECT id, creationDate, closedDate, deletionDate, score, ownerUserId, answerCount\n" +
            "FROM questions WHERE ownerUserId = :user")
    List<Question> findQuestionsFromUser(@Bind("user") int user);
}
We map the SQL results into our POJO Question. One thing to note is that I
reference columns by column index. In hindsight, I should have just referenced
the column name like I normally do instead of this nonesense. I can tell you
that I did not get the code right on my first try (I didn’t realize that column
indexing started at 1 and not 0). I was probably jealous that the Rust ORM,
Diesel, will codegen serialization code at compile time
using the index.
public class QuestionMapper implements ResultSetMapper<Question> {
    @Override
    public Question map(int i, ResultSet r, StatementContext ctx) throws SQLException {
        final ResultColumnMapper<LocalDateTime> dtmapper = ctx.columnMapperFor(LocalDateTime.class);
        return Question.create(
                r.getInt(1),
                dtmapper.mapColumn(r, 2, ctx),
                dtmapper.mapColumn(r, 3, ctx),
                dtmapper.mapColumn(r, 4, ctx),
                r.getInt(5),
                r.getInt(6),
                r.getInt(7)
        );
    }
}
Our POJO uses AutoValue for simple Java value objects.
@AutoValue
public abstract class Question {
    @JsonProperty
    public abstract int serial();

    @JsonProperty
    @JsonFormat(shape = JsonFormat.Shape.STRING, pattern = "yyyy-MM-dd")
    public abstract LocalDateTime creation();

    @JsonProperty
    @JsonFormat(shape = JsonFormat.Shape.STRING, pattern = "yyyy-MM-dd")
    public abstract Optional<LocalDateTime> closed();

    @JsonProperty
    @JsonFormat(shape = JsonFormat.Shape.STRING, pattern = "yyyy-MM-dd")
    public abstract Optional<LocalDateTime> deletion();

    @JsonProperty
    public abstract int score();

    @JsonProperty
    public abstract int ownerUserId();

    @JsonProperty
    public abstract int answers();

    public static Question create(
            int serial,
            LocalDateTime creation,
            LocalDateTime closed,
            LocalDateTime deletion,
            int score,
            int owner,
            int answers
    ) {
        return new AutoValue_Question(
                serial,
                creation,
                Optional.ofNullable(closed),
                Optional.ofNullable(deletion),
                score,
                owner,
                answers
        );
    }
}
And our resource is about as simple as one could construct.
@Path("/")
@Produces(MediaType.APPLICATION_JSON)
public class QuestionResource {
    private final QuestionQuery dao;
    public QuestionResource(QuestionQuery dao) {
        this.dao = dao;
    }

    @GET
    @Timed
    public List<Question> findQuestionsFromUser(@QueryParam("user") int userid) {
        return dao.findQuestionsFromUser(userid);
    }
}
The Test Harness
Once we deploy the Java application to the server, it’s benchmarking time. The test covers three variables:
- The max number of threads the webserver, Jetty, uses to serve requests
- The number of threads used by the database connector
- Which database connector to use: HikariCP / Tomcat.
Since one should not run the benchmarking code on the same box as the application, we move benchmarking code to another host to conserve limited resources. Once we move the benchmarking code to another box, we run into the problem of coordinating the start and stopping of tests with modifying the aforementioned variables. The solution is a script using ssh keys, but before that’s shown our base config looks like:
server:
  minThreads: 7
  maxThreads: ${maxThreads}
  adminConnectors: []
  requestLog:
    appenders: []
Yes, Dropwizard can use environment variables in configs.
The request log is disabled for performance.
Below is the actual script used to start and stop servers and load test using wrk.
#!/bin/bash

# The HikariCP test case extends the base yaml with the following
# additional configuration
HIKARI_YAML=$(cat <<'EOF'
hikari:
  datasourceClassName: org.postgresql.ds.PGSimpleDataSource
  properties:
    'databaseName': 'postgres'
  user: nick
  minSize: ${poolSize}
  maxSize: ${poolSize}
  password: nick
EOF
)

# The Tomcat test case extends the base yaml with the following
# additional configuration. Notice how more configuration options
# are specified, one of the selling points of Hikari is that
# there are no "unsafe" options.
TOMCAT_YAML=$(cat <<'EOF'
tomcat:
  driverClass: org.postgresql.Driver
  url: jdbc:postgresql://localhost/postgres
  user: nick
  minSize: ${poolSize}
  maxSize: ${poolSize}
  initialSize: ${poolSize}
  rollbackOnReturn: true
  checkConnectionOnBorrow: true
  autoCommitByDefault: false
  validationInterval: '1 second'
  validatorClassName: 'com.example.TomValidator'
  password: nick
EOF
)

# The actual function to do the load test
load_test () {
    YAML="$1"
    CONNECTIONS="$3"
    URL="http://benchmark:8080?user=87"

    # Nested for loop creates 42 configurations for each
    # test case, which causes this to be long script!
    for i in 1 2 4 8 16 32; do
    for j in 1 2 4 8 16 32 64; do
        export POOL_SIZE=$i
        export MAX_THREADS=$((6 + j))
        export CONFIG=$2
        echo "Pool: ${POOL_SIZE}. Server threads: ${MAX_THREADS}"
        echo "${YAML}" | ssh nick@benchmark "cat - config_base.yaml > config_new.yaml
            # Kill the previous server instance if one exists
            pkill java

            # Wait for it to cleanly shut down as we reuse ports, etc
            sleep 3s

            # Set the environment variables used in the configuration files
            # and use nohup so that when this ssh command (and connection) exits
            # the server keeps running
            poolSize=${POOL_SIZE} maxThreads=${MAX_THREADS} nohup \
                java -jar echo-db.jar server config_new.yaml >/dev/null 2>&1 &

            # Wait for the server to properly initialize
            sleep 5s"

        # Load test for 60 seconds with four threads (as this machine has four
        # CPUs to dedicate to load testing) Also use a custom lua script that
        # reports various statistics into a csv format for further analysis as
        # there'll be 80+ rows, with each row having several statistics.
        # We're using "tee" here so that we can see all the stdout but only
        # the last line, which is what is important to the csv is appended
        # to the csv
        wrk -c "$CONNECTIONS" -d 60s -t 4 -s report.lua ${URL} | \
            tee >(tail -n 1 >> wrk-$CONNECTIONS.csv)
    done;
    done;
}

# Call our function!
load_test "$TOMCAT_YAML" "tomcat" 300
load_test "$HIKARI_YAML" "hikari" 300
The custom lua script is the following (and this was my first time writing lua!). It’s nothing crazy.
done = function(summary, latency, requests)
    io.write(string.format("%s,%s,%s,%d,%d,%d,%d,%d,%d\n",
        os.getenv("CONFIG"),
        os.getenv("POOL_SIZE"),
        os.getenv("MAX_THREADS"),
        summary.requests,
        latency.mean,
        latency.stdev,
        latency:percentile(50),
        latency:percentile(90),
        latency:percentile(99)))
end
The Results
HikariCP is both the best and the worst when it comes to mean response, 99th percentile in response time, and requests served. It all comes down to how the server and the pool is configured. A properly tuned Hikari pool will beat Tomcat; however, I know very little people who would take the time to benchmark until the right configuration is found. It’s not easy work. Each test run takes over an hour, and time is money. In a big corporpation these benchmarking tests could be ran in parallel, but when you’re one man show you wait that hour!
But for what is worth, I’ll let the data speak for itself. Since we saved our
wrk data into a csv we can analyze this using R. For any graph or table, the
source code to generate it is located underneath it.
library(tidyverse)
library(readr)

columns <- c("config", "pool size", "max threads", "requests", "mean", "stdev", "p50", "p90", "p99")
df <- read_csv("/home/nick/Downloads/wrk-100.csv", col_names = columns)

# Subtract 6 from max threads because Jetty uses six threads to manage the request
# threads and other activities
df <- mutate(df, `max threads` = `max threads` - 6)
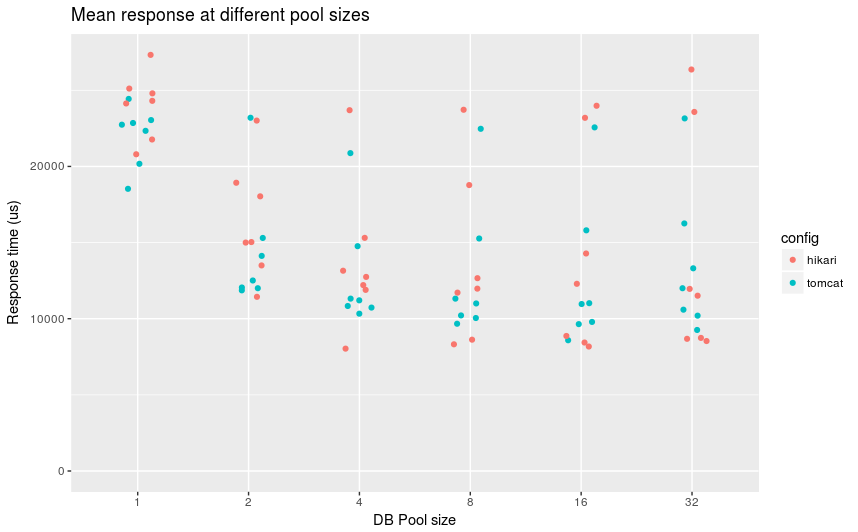
Mean time to serve HTTP response with given connection pool
ggplot(df, aes(factor(`pool size`), mean, ymin=0)) +
  geom_jitter(aes(colour = config), width=0.15) +
  labs(title = "Mean response at different pool sizes",
       x = "DB Pool size",
       y = "Response time (us)")
For pool sizes greater than 1, most configuration have a mean time between 10ms and 15ms. With Hikari containing about 2/3 of the configurations below 10ms. We can see that between pool sizes of 2 to 8, Hikari contained fewer number of configurations where the average response time was above 20ms where compared to itself in at other pool sizes.
The worst mean response time belongs to Hikari in each category.
How does the trend hold when looking at the the 99th percentile in response times.
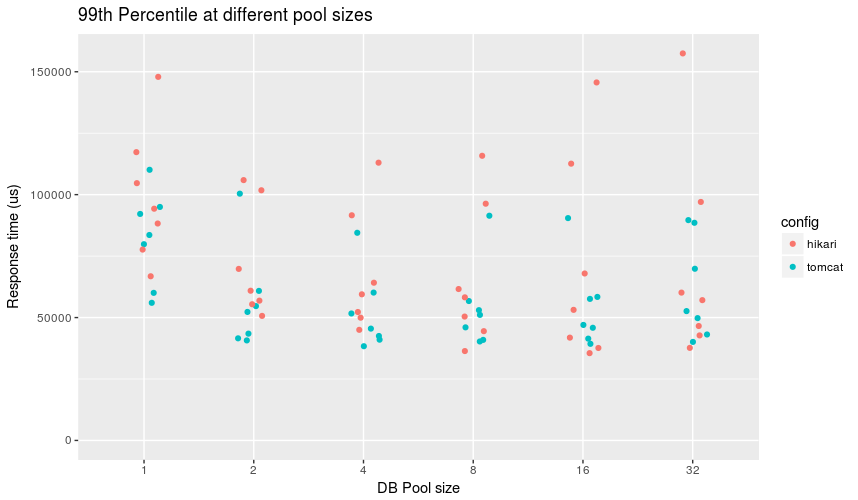
99th percentile in time to serve HTTP response with given connection pool
ggplot(df, aes(factor(`pool size`), p99, ymin=0)) +
  geom_jitter(aes(colour = config), width=0.15) +
  labs(title = "99th Percentile at different pool sizes",
       x = "DB Pool size",
       y = "Response time (us)")
In an interesting turn of events, looking at 99th percentiles below 50ms, Tomcat edges out with more faster configurations, but Hikari still can claim the best 99th percentile across the configurations where pool size is greater than 1, which we can consider our baseline.
Now let’s move onto the number of requests that each configuration served at a given database pool size.
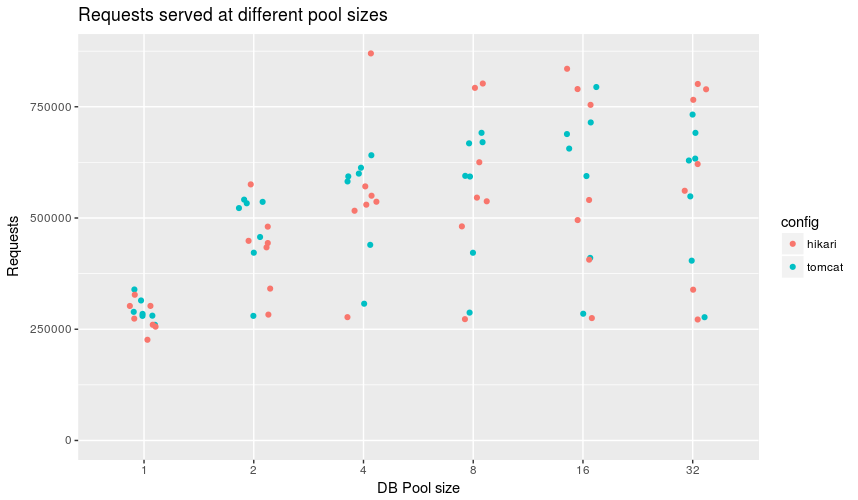
Number of responses served in 60 seconds
ggplot(df, aes(factor(`pool size`), requests, ymin=0)) +
  geom_jitter(aes(colour = config), width=0.15) +
  labs(title = "Requests served at different pool sizes",
       x = "DB Pool size",
       y = "Requests")
Hikari shined here by having a configuration that did significantly better than others in pool size 4. The next top 5 in that category were all Tomcat so potential celebration should be muted. Across all categories Hikari had the most and least requests served depending on the configuration.
Let’s narrow our focus to just a pool size of 4, as it seems to bring out the best performance, and see how configuring Jetty threads affects response times.
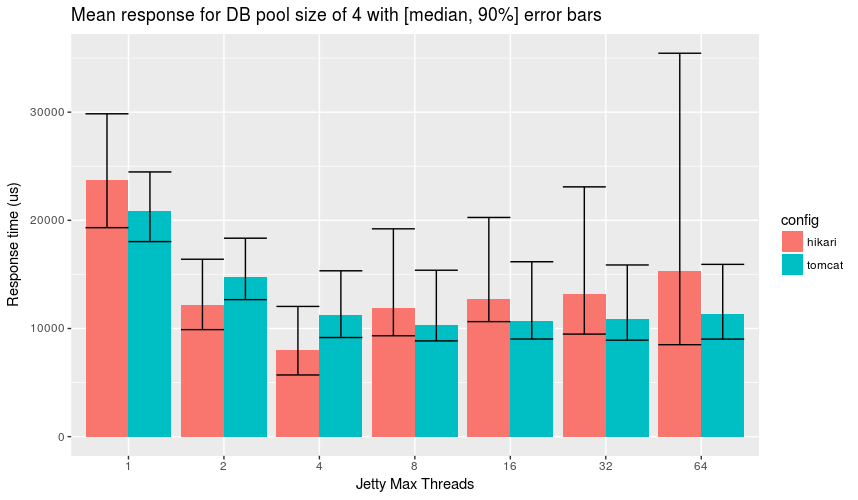
Tweaking number of HTTP server threads
dodge <- position_dodge(width=.9)
df %>% filter(`pool size` == 4) %>%
  ggplot(aes(factor(`max threads`), mean, fill=config)) +
  geom_bar(stat='identity', position=dodge) +
  geom_errorbar(aes(ymin = p50, ymax = p90), position=dodge) +
  labs(title = "Mean response for DB pool size of 4 with [median, 90%] error bars",
       x = "Jetty Max Threads",
       y = "Response time (us)")
The graph may need a bit of an explanation:
- The bars represent the mean response for that number of Jetty threads
- The lower whisker is that median for that configuration. Notice how it is always lower than the mean, thus a response time graph would be scewed right
- The upper whisker represents the 90th percentile of response time and gives a rough idea of how big the skew is.
The graph depicts that the best overall configuration is to use a hikari db
pool of 4 connections with Jetty having 4 threads to accept incoming db
requests (which, remember, corresponds to a maxThreads: 10 in the dropwizard
config).
As Jetty allocates more threads to handle db requests, Hikari performance
suffers under this contention worse than Tomcat, which explains why one needs
to explore secondary variables as if I used the dropwizard default of
maxThreads: 100 then Hikari would have “lost” across the board.
Interpretation
Why 4? Why so low? On the Hikari wiki, there is a great article about pool sizing, where I learned a lot. I highly suggest reading it. Anyways, 4 is also the number of “virtual processors” that are allocated to the benchmarking machine, which is spread amongst the application and the database.
By configuring Jetty to use 4 threads to accept 4 requests at a time, there is no contention for the connection pool. All backpressure is handled by Jetty. Why Jetty appears to handle backpressure better than Hikari is a bit of a puzzle to me, considering Hikari claims to performance better under contention than other database pools.
Tables
Here are some tables for various best and worst configurations.
Fastest 5 average time:
| pool | pool size | jetty threads | mean response (us) |
|---|---|---|---|
| hikari | 4 | 4 | 8035 |
| hikari | 16 | 4 | 8174 |
| hikari | 8 | 8 | 8319 |
| hikari | 16 | 8 | 8436 |
| hikari | 32 | 4 | 8534 |
# Fastest 5 by mean response
df %>% top_n(-5, mean) %>%
  arrange(mean) %>%
  transmute(str = str_c("|", str_c(config, `pool size`, `max threads`, mean, sep="|"), "|"))
Slowest 5 average time:
| pool | pool size | jetty threads | mean response (us) |
|---|---|---|---|
| hikari | 1 | 4 | 27325 |
| hikari | 32 | 64 | 26365 |
| hikari | 1 | 8 | 25113 |
| hikari | 1 | 2 | 24799 |
| tomcat | 1 | 8 | 24433 |
# Slowest 5 by mean response
df %>% top_n(5, mean) %>%
  arrange(-mean) %>%
  transmute(str = str_c("|", str_c(config, `pool size`, `max threads`, mean, sep="|"), "|"))
Fastest 5 by 99% percentile in response
| pool | pool size | jetty threads | 99% percentile (us) |
|---|---|---|---|
| hikari | 16 | 8 | 35517 |
| hikari | 8 | 8 | 36363 |
| hikari | 16 | 16 | 37620 |
| hikari | 32 | 16 | 37666 |
| tomcat | 4 | 32 | 38342 |
# Fastest 5 by 99% percentile in response
df %>% top_n(-5, p99) %>%
  arrange(p99) %>%
  transmute(str = str_c("|", str_c(config, `pool size`, `max threads`, p99, sep="|"), "|"))
Slowest 5 by 99th percentile in response
| pool | pool size | jetty threads | 99% percentile (us) |
|---|---|---|---|
| hikari | 32 | 64 | 157454 |
| hikari | 1 | 64 | 147926 |
| hikari | 16 | 64 | 145653 |
| hikari | 1 | 1 | 117293 |
| hikari | 8 | 64 | 115814 |
# Slowest 5 by 99% percentile in response
df %>% top_n(5, p99) %>%
  arrange(-p99) %>%
  transmute(str = str_c("|", str_c(config, `pool size`, `max threads`, p99, sep="|"), "|"))
Top 5 for requests served:
| pool | pool size | jetty threads | requests |
|---|---|---|---|
| hikari | 4 | 4 | 869924 |
| hikari | 16 | 4 | 835446 |
| hikari | 8 | 8 | 802282 |
| hikari | 32 | 4 | 801283 |
| tomcat | 16 | 16 | 794392 |
# Top 5 for requests served
df %>% top_n(-5, requests) %>%
  arrange(requests) %>%
  transmute(str = str_c("|", str_c(config, `pool size`, `max threads`, requests, sep="|"), "|"))
Bottom 5 for requests served:
| pool | pool size | jetty threads | requests |
|---|---|---|---|
| hikari | 1 | 4 | 226305 |
| hikari | 1 | 8 | 255766 |
| tomcat | 1 | 8 | 259909 |
| hikari | 1 | 2 | 260054 |
| hikari | 32 | 1 | 271876 |
# Bottom 5 for requests served
df %>% top_n(5, requests) %>%
  arrange(-requests) %>%
  transmute(str = str_c("|", str_c(config, `pool size`, `max threads`, requests, sep="|"), "|"))
Conclusion
Neither HikariCP or Tomcat were the clear winner. While HikariCP had the best performance, it also had the worst performance depending on configuration. Whereas Tomcat was able to execute at a consistent level.
HikariCP claims to be safer, but I don’t consider Tomcat unsafe.
Tomcat is used by default in Dropwizard, but HikariCP has third party modules to hook into Dropwizard.
Thus, I’ve become inconclusive. Your decision, but if you want to be sure, benchmark your application!
Appendix
The application code:
public class EchoApplication extends Application<EchoConfiguration> {
    public static void main(final String[] args) throws Exception {
        new EchoApplication().run(args);
    }

    @Override
    public String getName() {
        return "Echo";
    }

    @Override
    public void initialize(final Bootstrap<EchoConfiguration> bootstrap) {
        bootstrap.setConfigurationSourceProvider(
                new SubstitutingSourceProvider(bootstrap.getConfigurationSourceProvider(),
                        new EnvironmentVariableSubstitutor(true)
                )
        );
    }

    @Override
    public void run(final EchoConfiguration config,
                    final Environment environment) {
        final DBIFactory factory = new DBIFactory();

        // Since Java generic are not covariant we must use map:
        // http://stackoverflow.com/q/2660827/433785
        final Optional<PooledDataSourceFactory> tomcatFactory = config.getTomcatFactory().map(x -> x);
        final Optional<PooledDataSourceFactory> hikariFactory = config.getHikariFactory().map(x -> x);
        final PooledDataSourceFactory datasource = tomcatFactory.orElse(hikariFactory.orElse(null));
        final DBI jdbi = factory.build(environment, datasource, "postgresql");
        jdbi.registerMapper(new QuestionMapper());
        final QuestionQuery dao = jdbi.onDemand(QuestionQuery.class);
        environment.jersey().register(new QuestionResource(dao));
    }
}
I created a custom PooledDataSourceFactory to set up the Hikari connections
instead of reusing those in other dropwizard-hikari projects as they either
didn’t expose the properties I wanted or didn’t derive from
PooledDataSourceFactory. I won’t copy the whole class that I created as it is
pretty “boiler-platey”, so here’s the main chunk:
@Override
public ManagedDataSource build(final MetricRegistry metricRegistry, final String name) {
    final Properties properties = new Properties();
    for (final Map.Entry<String, String> property : this.properties.entrySet()) {
        properties.setProperty(property.getKey(), property.getValue());
    }

    final HikariConfig config = new HikariConfig();
    config.setAutoCommit(this.autoCommit);
    config.setDataSourceProperties(properties);
    config.setDataSourceClassName(this.datasourceClassName);
    config.setMaximumPoolSize(this.maxSize);
    config.setMinimumIdle(this.minSize);
    config.setPoolName(name);
    config.setUsername(this.user);
    config.setPassword(this.user != null && this.password == null ? "" : this.password);
    config.setConnectionTestQuery(this.validationQuery);
    return new HikariManagedPooledDataSource(config, metricRegistry);
}
If you’re wondering what the TomValidator is from the configuration, it’s a custom class to validate Tomcat connections.
/* A custom Tomcat connection validator, which returns true if the connection
   is valid. Taken from the HikariCP-benchmark project:
   https://github.com/brettwooldridge/HikariCP-benchmark/blob/c6bb2da16b70933fb83bdcdb662ce6bf1f7ae991/src/main/java/com/zaxxer/hikari/benchmark/BenchBase.java */
public class TomValidator implements Validator {
    @Override
    public boolean validate(Connection connection, int validateAction) {
        try {
            return (validateAction != PooledConnection.VALIDATE_BORROW || connection.isValid(0));
        } catch (SQLException e) {
            return false;
        }
    }
}
Comments
If you'd like to leave a comment, please email [email protected]
Hi,
Brett Wooldridge, author of HikariCP here. Thank your for taking the time to perform such as test.
I do have a few questions, and a few comments.
My first question is, what version of HikariCP was used in the test? The large variance in performance under contention makes me think it may have been run under v2.6.0. HikariCP v2.6.0 contained a rather serious performance regression in the contention code path.
I am quite happy to see comparisons with other pools, and as you know benchmarking is sometimes difficult, so the following comments are discrepancies I found that make it not quite an apples-to-apples comparison.
Validation
The Tomcat pool was using
Connection.isValid()(via the validator class), while HikariCP was configured to use a SQL query (config.setConnectionTestQuery()). If the query is left un-set in HikariCP, it will also useConnection.isValid(). If a validator is set on Tomcat, as it is here, any similar test query is/was also configured on Tomcat would be ignored and preference given to the validator.JDBC Compliance/Unsafe
Tomcat states explicitly:
This means, if Thread A changes the transaction isolation to
READ_UNCOMMITTEDand then returns the connection to the pool, the unsuspecting Thread B who obtains the same connection inherits that change. Or if the pool isautoCommit=trueby default, and Thread A changes a connection toautoCommit=falseand returns the connection to the pool, other unsuspecting threads suddenly receive non-auto commit Connections and will have their transactions rolled back if they never explicitly callcommit().This is “Unsafe Case #1”, and is solved by configuring the
org.apache.tomcat.jdbc.pool.interceptor.ConnectionStateinterceptor. With this interceptor, Tomcat will properly reset connection state.The JDBC specification also requires that when Connections are closed, any open Statements will also be closed. And the specification states that when a Statement is closed, any associated ResultSets will be closed. So, there is a kind of cascade cleanup that occurs. Failing to close Statements and ResultSets can leave cursors open and locks held, causing potential unexplained deadlocks in the DB.
“Unsafe Case #2” is that Tomcat also does not do this by default. This is solved by configuring the
org.apache.tomcat...StatementFinalizerinterceptor.The HikariCP benchmark does not configure this, because at the rate that it runs (+50K iterations per/ms!) Tomcat falls over with an OutOfMemory exception. However, for “normal” workloads, setting this interceptor is essential for safety, but definitely has a non-zero impact.
By default, Tomcat does not use “disposable facades”, unless
setUseDisposableConnectionFacade()is configured. So, what is a disposable facade? Connections in a pool that are “closed” by an application are not really closed, they are returned to the pool. According to the JDBC specification, once a Connection is closed, calling methods likecreateStatement()etc. should throw a SQLException.In Tomcat’s case, if Thread A closes a Connection but retains a reference to the Connection instance, it can continue to use the Connection. This means if Thread B obtains that Connection from the pool, Thread A can execute SQL that gets mixed into Thread B’s transaction. If that weren’t bad enough, if that SQL fails, all of Thread B’s work on that transaction will also be rolled back. Thread A may also execute
commit()on the Connection, which can commit Thread B’s work in the middle of its transaction. Debugging that kind of issue is the stuff of nightmares.Final Thoughts
Taken as a whole, I think it is extremely difficult for the average user to configure Tomcat for compliant/safe behavior, as seen here. I suspect the vast majority of Tomcat deployments have not done so. I would personally gladly trade minor inefficiences caused by an improperly size pool over the kinds of failures that can occur in production with an improperly configured Tomcat.
Having said that, I am also confident that if HikariCP v2.6.1 is used, and Tomcat is configured for similar levels of reliability as detailed here, the performance gap between the two will widen quite a bit – at all pool sizes and concurrency levels.